FusionAnalytics Perspectives: Server
The World of Deep Server Analysis
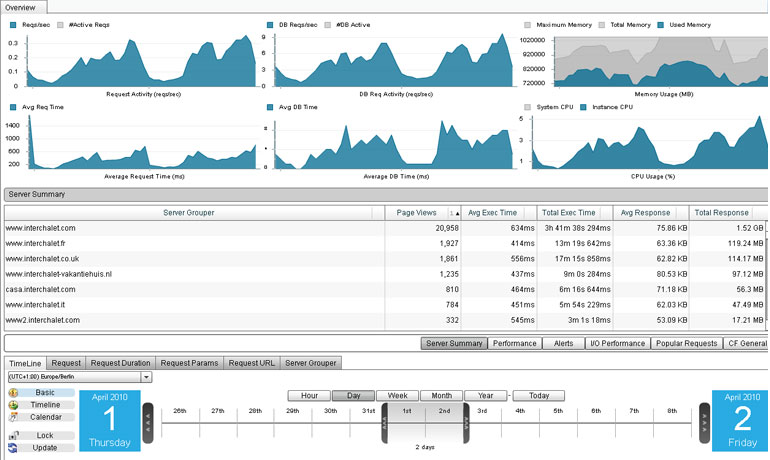
Overview
Default perspective, providing instant insight into server utilization (highlights last 3 hours of server activity) including a breakdown of server utilization by hostname (per project/customer/language), Total Response Size, Average Execution Time (per site) and Total Execution Time.

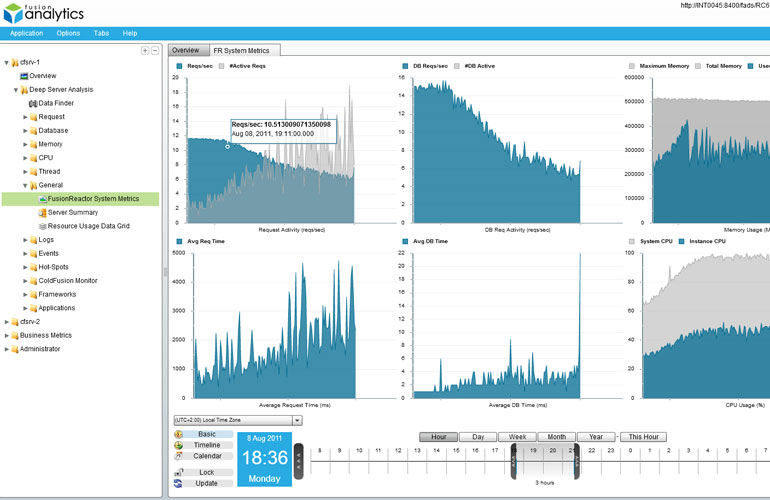
FusionReactor System Metrics
Shows a combined view of 6 graphs, including Request Load, Request Time, JDBC Load, JDBC Request Time, Memory Demand, and CPU.

