FusionAnalytics Perspectives: Database
The World of Deep Server Analysis
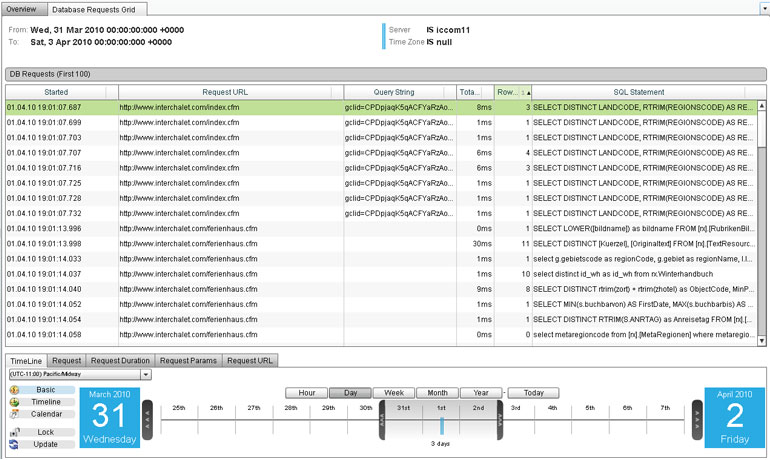
Request Grid
Shows a breakdown of all the requests which have taken place over the selected time period. Details include time when the query ran, SQL query string, rows returned, and DB Execution Time.

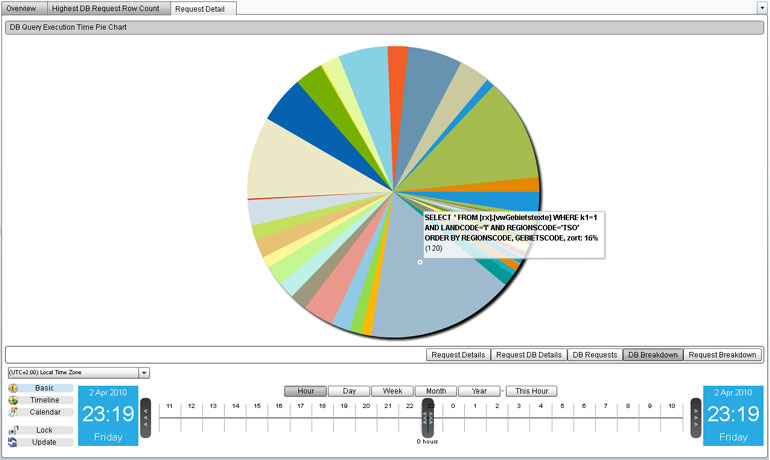
DB Breakdown
From within a request you can select the DB Breakdown tab, which shows where the DB time is being spent on a query-by-query basis. Hovering over a segment of the pie chart will reveal the actual SQL statement being called.

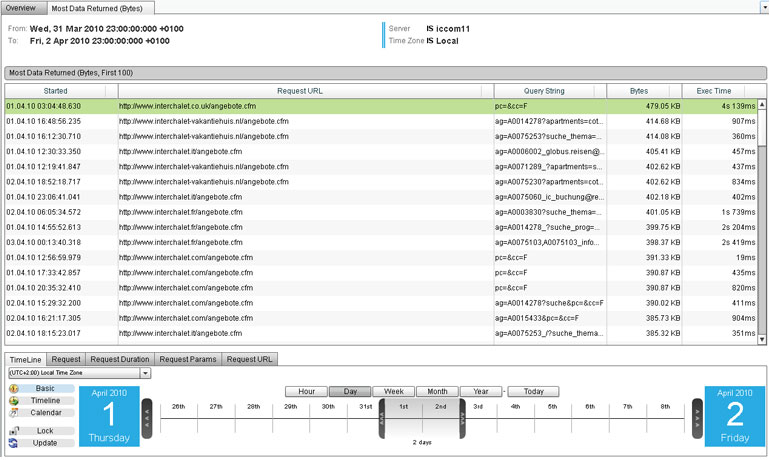
Most Data Returned
See which queries are returning the most data.

